Chart Review Table
USC Biomedical Student Research Seminar
Jonathan Nelson
25 April, 2026
library(readxl)
library(dplyr)
library(purrr)
library(tibble)
library(gtsummary)
library(gt)
library(ggplot2)
1 Introduction
This code was generated for the 2026 Biomedical Research Seminar at the University of Southern California by Jonathan Nelson. It creates a descriptive summary table comparing patient, perioperative, pathologic, and postoperative outcomes between surgical approaches, and includes p-values and statistical test labels for each comparison.
The analysis uses a de-identified dataset provided by Sammie Rosen. The dataset includes demographic, clinical, operative, histologic, and follow-up variables collected for patients undergoing extraperitoneal versus transvesical simple prostatectomy.
1.1 Download folder with files for analysis
1.2 Load in the Dataset
1.3 Name and Factor Table
df <- read_excel("MASTER EP vs TV simples - deidentified.xlsx", sheet = "Sheet1") %>%
  mutate(
    approach = factor(
      `Surgical Approach (1=EP or 2=TV)`,
      levels = c(1, 2),
      labels = c("Extraperitoneal", "Transvesical")
    ),

    `HTN status (0=No or 1=Yes)` = factor(`HTN status (0=No or 1=Yes)`, levels = c(0, 1), labels = c("No", "Yes")),
    `DM2 status (0=No or 1=Yes)` = factor(`DM2 status (0=No or 1=Yes)`, levels = c(0, 1), labels = c("No", "Yes")),
    `HLD (0=No or 1=Yes)` = factor(`HLD (0=No or 1=Yes)`, levels = c(0, 1), labels = c("No", "Yes")),
    `prior Inguinal Hernia/pelvic surgery (0=No or 1=Yes)` = factor(`prior Inguinal Hernia/pelvic surgery (0=No or 1=Yes)`, levels = c(0, 1), labels = c("No", "Yes")),
    `Prior Abdominal Surgery (0=No or 1=Yes)` = factor(`Prior Abdominal Surgery (0=No or 1=Yes)`, levels = c(0, 1), labels = c("No", "Yes")),

    `Pre-Op Biopsy Done (0=No 1=Yes)` = factor(`Pre-Op Biopsy Done (0=No 1=Yes)`, levels = c(0, 1), labels = c("No", "Yes")),
    `Pre-Op Biopsy Result (0=Neg 1=Pos)` = factor(`Pre-Op Biopsy Result (0=Neg 1=Pos)`, levels = c(0, 1), labels = c("Negative", "Positive")),
    `Pre-Op Foley Present (0=No 1=Yes)` = factor(`Pre-Op Foley Present (0=No 1=Yes)`, levels = c(0, 1), labels = c("No", "Yes")),

    `Lymph Node Dissection (0=No or 1=Yes)` = factor(`Lymph Node Dissection (0=No or 1=Yes)`, levels = c(0, 1), labels = c("No", "Yes")),
    `Conversion (0=No or 1=Yes)` = factor(`Conversion (0=No or 1=Yes)`, levels = c(0, 1), labels = c("No", "Yes")),
    `Drain placement (0=No or 1=Yes)` = factor(`Drain placement (0=No or 1=Yes)`, levels = c(0, 1), labels = c("No", "Yes")),
    `pRBCs given (0=No 1=Yes)` = factor(`pRBCs given (0=No 1=Yes)`, levels = c(0, 1), labels = c("No", "Yes")),

    `LOS (0=Same Day 1=Inpatient)` = factor(`LOS (0=Same Day 1=Inpatient)`, levels = c(0, 1), labels = c("Same Day", "Inpatient")),
    `Narcotics (PO day 0-1) (0 = no, 1 = yes)` = factor(`Narcotics (PO day 0-1) (0 = no, 1 = yes)`, levels = c(0, 1), labels = c("No", "Yes")),
    `30-Day Readmission (0=No or 1=Yes)` = factor(`30-Day Readmission (0=No or 1=Yes)`, levels = c(0, 1), labels = c("No", "Yes")),
    `Early Continence at 6 Weeks (0=No or 1=Yes) continent = no pads or 1 protection pad` =
      factor(`Early Continence at 6 Weeks (0=No or 1=Yes) continent = no pads or 1 protection pad`,
             levels = c(0, 1), labels = c("No", "Yes")),
    `Continence 3 Months (0=No or 1=Yes)` = factor(`Continence 3 Months (0=No or 1=Yes)`, levels = c(0, 1), labels = c("No", "Yes")),
    `30 day Complications (0=no 1=Yes)` = factor(`30 day Complications (0=no 1=Yes)`, levels = c(0, 1), labels = c("No", "Yes")),

    `ASA (1-5)` = factor(`ASA (1-5)`)
  )

df
1.4 Let’s Look at One of the Variables
1.4.1 Age at Time of Surgery
##  [1] 72 73 61 83 63 69 67 75 72 73 76 71 74 84 62 70 64 67 88 75 82 79 76 67 74
## [26] 59 71 74 80 74 76 72 65 62 74 76 80 72 78 81 65 68 68 77 85 80 70 75 67 72
## [51] 71 75 64 58 74 64 66 58
1.4.1.1 Calculate the Statistic
df %>%
  group_by(approach) %>%
  summarise(
    mean_age = mean(`Age (at time of surgery)`, na.rm = TRUE),
    sd_age   = sd(`Age (at time of surgery)`, na.rm = TRUE),
    .groups = "drop"
)##
## Wilcoxon rank sum test with continuity correction
##
## data: Age (at time of surgery) by approach
## W = 441.5, p-value = 0.654
## alternative hypothesis: true location shift is not equal to 0summary_df <- df %>%
group_by(approach) %>%
summarise(
mean_age = mean(`Age (at time of surgery)`, na.rm = TRUE),
.groups = "drop"
)
ggplot(df, aes(x = approach, y = `Age (at time of surgery)`)) +
geom_jitter(width = 0.15, alpha = 0.6, size = 4) +
geom_point(
data = summary_df,
aes(x = approach, y = mean_age),
color = "red",
size = 6
) +
labs(
x = "Approach",
y = "Age (at time of surgery)",
title = "Age Distribution by Surgical Approach (with Means)"
) +
theme_classic()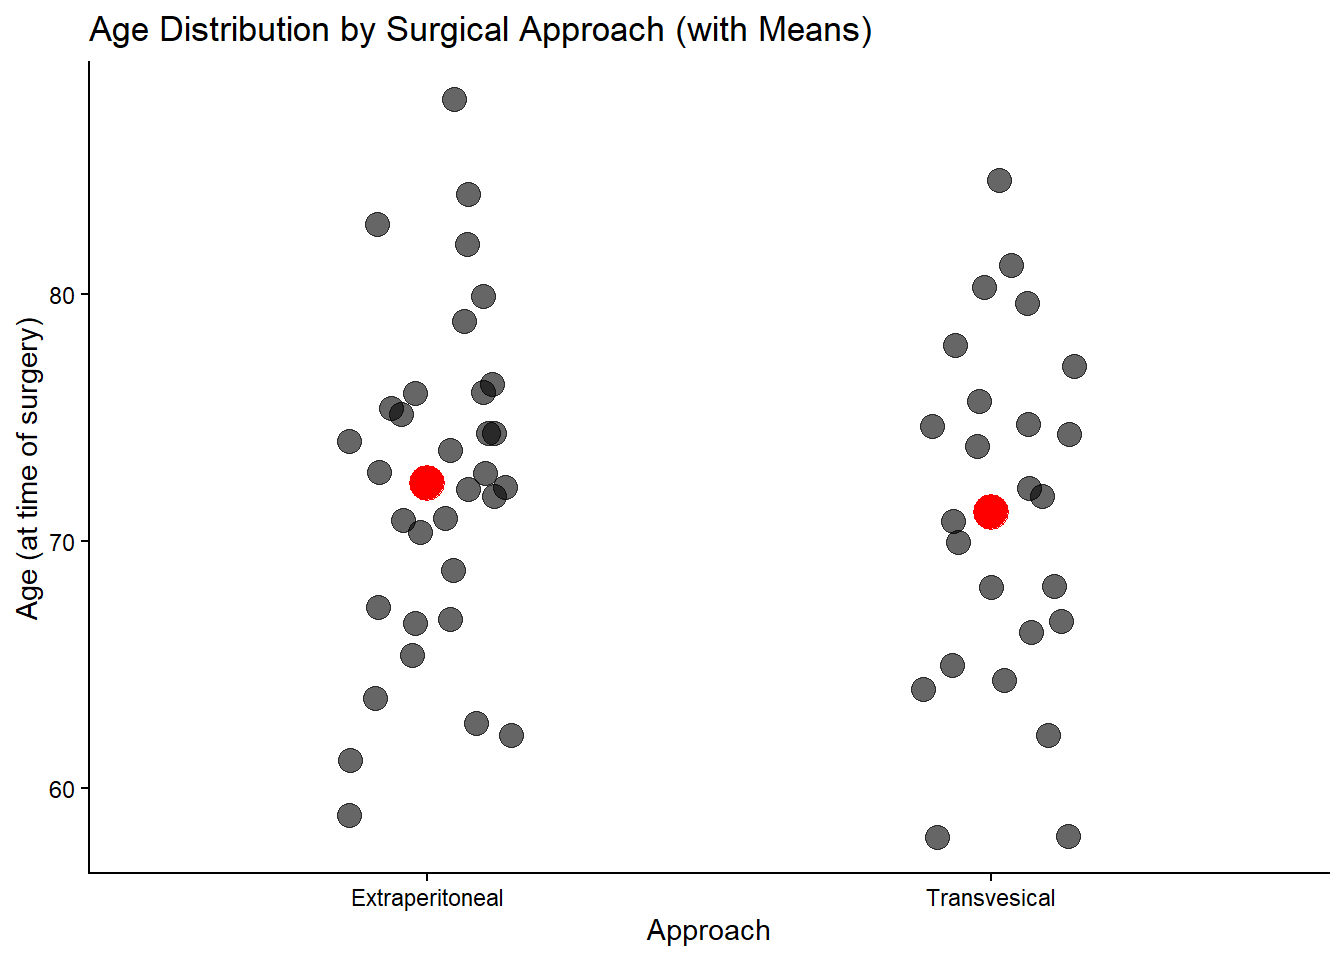
1.4.1.2 Putting It Into a Table
# Summary stats
age_summary <- df %>%
  group_by(approach) %>%
  summarise(
    mean = mean(`Age (at time of surgery)`, na.rm = TRUE),
    sd   = sd(`Age (at time of surgery)`, na.rm = TRUE),
    .groups = "drop"
  )

# Format into one row
age_tbl <- tibble(
  Variable = "Age (yr)",
  Extraperitoneal = sprintf("%.1f (%.1f)",
                            age_summary$mean[age_summary$approach == "Extraperitoneal"],
                            age_summary$sd[age_summary$approach == "Extraperitoneal"]),
  Transvesical = sprintf("%.1f (%.1f)",
                         age_summary$mean[age_summary$approach == "Transvesical"],
                         age_summary$sd[age_summary$approach == "Transvesical"]),
  `P-value` = formatC(
    wilcox.test(`Age (at time of surgery)` ~ approach, data = df)$p.value,
    format = "f", digits = 3
  ),
  Test = "Wilcoxon rank-sum"
)

age_tbl %>%
gt()| Variable | Extraperitoneal | Transvesical | P-value | Test |
|---|---|---|---|---|
| Age (yr) | 72.4 (6.8) | 71.2 (7.2) | 0.654 | Wilcoxon rank-sum |
1.5 Working Table
df <- read_excel("MASTER EP vs TV simples - deidentified.xlsx", sheet = "Sheet1") %>%
  mutate(
    approach = factor(
      `Surgical Approach (1=EP or 2=TV)`,
      levels = c(1, 2),
      labels = c("Extraperitoneal", "Transvesical")
    ),

    `HTN status (0=No or 1=Yes)` = factor(`HTN status (0=No or 1=Yes)`, levels = c(0, 1), labels = c("No", "Yes")),
    `DM2 status (0=No or 1=Yes)` = factor(`DM2 status (0=No or 1=Yes)`, levels = c(0, 1), labels = c("No", "Yes")),
    `HLD (0=No or 1=Yes)` = factor(`HLD (0=No or 1=Yes)`, levels = c(0, 1), labels = c("No", "Yes")),
    `prior Inguinal Hernia/pelvic surgery (0=No or 1=Yes)` = factor(`prior Inguinal Hernia/pelvic surgery (0=No or 1=Yes)`, levels = c(0, 1), labels = c("No", "Yes")),
    `Prior Abdominal Surgery (0=No or 1=Yes)` = factor(`Prior Abdominal Surgery (0=No or 1=Yes)`, levels = c(0, 1), labels = c("No", "Yes")),

    `Pre-Op Biopsy Done (0=No 1=Yes)` = factor(`Pre-Op Biopsy Done (0=No 1=Yes)`, levels = c(0, 1), labels = c("No", "Yes")),
    `Pre-Op Biopsy Result (0=Neg 1=Pos)` = factor(`Pre-Op Biopsy Result (0=Neg 1=Pos)`, levels = c(0, 1), labels = c("Negative", "Positive")),
    `Pre-Op Foley Present (0=No 1=Yes)` = factor(`Pre-Op Foley Present (0=No 1=Yes)`, levels = c(0, 1), labels = c("No", "Yes")),

    `Lymph Node Dissection (0=No or 1=Yes)` = factor(`Lymph Node Dissection (0=No or 1=Yes)`, levels = c(0, 1), labels = c("No", "Yes")),
    `Conversion (0=No or 1=Yes)` = factor(`Conversion (0=No or 1=Yes)`, levels = c(0, 1), labels = c("No", "Yes")),
    `Drain placement (0=No or 1=Yes)` = factor(`Drain placement (0=No or 1=Yes)`, levels = c(0, 1), labels = c("No", "Yes")),
    `pRBCs given (0=No 1=Yes)` = factor(`pRBCs given (0=No 1=Yes)`, levels = c(0, 1), labels = c("No", "Yes")),

    `LOS (0=Same Day 1=Inpatient)` = factor(`LOS (0=Same Day 1=Inpatient)`, levels = c(0, 1), labels = c("Same Day", "Inpatient")),
    `Narcotics (PO day 0-1) (0 = no, 1 = yes)` = factor(`Narcotics (PO day 0-1) (0 = no, 1 = yes)`, levels = c(0, 1), labels = c("No", "Yes")),
    `30-Day Readmission (0=No or 1=Yes)` = factor(`30-Day Readmission (0=No or 1=Yes)`, levels = c(0, 1), labels = c("No", "Yes")),
    `Early Continence at 6 Weeks (0=No or 1=Yes) continent = no pads or 1 protection pad` =
      factor(`Early Continence at 6 Weeks (0=No or 1=Yes) continent = no pads or 1 protection pad`,
             levels = c(0, 1), labels = c("No", "Yes")),
    `Continence 3 Months (0=No or 1=Yes)` = factor(`Continence 3 Months (0=No or 1=Yes)`, levels = c(0, 1), labels = c("No", "Yes")),
    `30 day Complications (0=no 1=Yes)` = factor(`30 day Complications (0=no 1=Yes)`, levels = c(0, 1), labels = c("No", "Yes")),

    `ASA (1-5)` = factor(`ASA (1-5)`)
  )

baseline_labels <- list(
  `Age (at time of surgery)` ~ "Age (yr)",
  BMI ~ "BMI (kg/m^2)",
  CCI ~ "CCI",
  `ASA (1-5)` ~ "ASA physical status grading",
  `HTN status (0=No or 1=Yes)` ~ "History of hypertension",
  `DM2 status (0=No or 1=Yes)` ~ "History of type 2 diabetes mellitus",
  `HLD (0=No or 1=Yes)` ~ "History of hyperlipidemia",
  `prior Inguinal Hernia/pelvic surgery (0=No or 1=Yes)` ~ "History of prior inguinal/pelvic surgery",
  `Prior Abdominal Surgery (0=No or 1=Yes)` ~ "History of prior abdominal surgery",
  `Pre-op Hgb` ~ "Pre-op Hgb",
  `Pre-op PSA` ~ "Pre-op PSA (ng/mL)",
  `Pre-op Prostate Volume (g)` ~ "Prostate volume (ml)"
)

preop_labels <- list(
  `SHIM Score (pre-op)` ~ "SHIM",
  `IPSS (pre-op)` ~ "IPSS",
  `QOL (pre-op)` ~ "QoL",
  `Pre-Op Biopsy Done (0=No 1=Yes)` ~ "Biopsy done",
  `Pre-Op Biopsy Result (0=Neg 1=Pos)` ~ "Malignancy on biopsy",
  `Pre-Op Foley Present (0=No 1=Yes)` ~ "Pre-op foley placed"
)

intraop_labels <- list(
  `Console Time (minutes)` ~ "Console time (minutes)",
  `Operative Time (minutes)` ~ "Operative time (minutes)",
  `EBL (cc)` ~ "Estimated blood loss (mL)",
  `Conversion (0=No or 1=Yes)` ~ "Conversion to multiport",
  `Lymph Node Dissection (0=No or 1=Yes)` ~ "Lymph node dissection",
  `Drain placement (0=No or 1=Yes)` ~ "Drain placement",
  `pRBCs given (0=No 1=Yes)` ~ "Blood units given",
  `delta Hgb` ~ "dHgb (%)"
)

histology_labels <- list(
  `Specimen Weight (g)` ~ "Specimen weight (g)",
  `Specimen weight/pre-op estmated weight` ~ "Specimen wt/pre-op estimated wt",
  `Pathologic Diagnosis (incidental malignancy) 0= benign 1= malignant` ~ "Incidental malignancy finding"
)

postop_care_labels <- list(
  `LOS (0=Same Day 1=Inpatient)` ~ "Length of stay <24 hours",
  `LOS (hours) (look at note times)` ~ "Average length of stay (hours)",
  `Narcotics (PO day 0-1) (0 = no, 1 = yes)` ~ "Narcotics use post-op day 0-1",
  `Postop Pain Score (PACU)` ~ "Post Op Pain Score",
  `Foley Duration (Days post-op)` ~ "Foley catheter duration (days)"
)

outcome_labels <- list(
  `30 day Complications (0=no 1=Yes)` ~ "30 day postoperative complications (Clavien >=2 only)",
  `30-Day Readmission (0=No or 1=Yes)` ~ "30 day readmission",
  `Post-op PVR` ~ "Post-op PVR",
  `Early Continence at 6 Weeks (0=No or 1=Yes) continent = no pads or 1 protection pad` ~ "Early Continence at 4 weeks",
  `Continence 3 Months (0=No or 1=Yes)` ~ "Continence at 3 months"
)

format_p <- function(x) {
  dplyr::case_when(
    is.na(x) ~ NA_character_,
    x < 0.001 ~ "<0.001",
    TRUE ~ formatC(x, format = "f", digits = 3)
  )
}

safe_pvalue <- function(data, group_var, var, continuous = FALSE) {
  x <- data[[var]]
  g <- data[[group_var]]
  keep <- complete.cases(x, g)
  x <- x[keep]
  g <- g[keep]

  if (length(unique(g)) < 2) return(NA_real_)

  tryCatch({
    if (continuous) {
      wilcox.test(x ~ g)$p.value
    } else {
      tab <- table(x, g)
      if (any(dim(tab) < 2)) return(NA_real_)
      if (all(dim(tab) == c(2, 2))) {
        fisher.test(tab)$p.value
      } else {
        suppressWarnings(chisq.test(tab, correct = FALSE)$p.value)
      }
    }
  }, error = function(e) NA_real_)
}

calc_manual_pvals <- function(data, group_var, vars, continuous_vars) {
  map_dfr(vars, function(v) {
    tibble(
      variable = v,
      manual_p = safe_pvalue(data, group_var, v, continuous = v %in% continuous_vars)
    )
  })
}

attach_manual_pvals <- function(tbl, pvals) {
  tbl %>%
    modify_table_body(
      ~ .x %>%
        left_join(pvals, by = "variable") %>%
        mutate(
          p.value = if_else(
            row_type == "label",
            format_p(manual_p),
            NA_character_
          )
        ) %>%
        select(-manual_p)
    ) %>%
    modify_header(p.value ~ "**P-value**") %>%
    modify_column_unhide(p.value)
}

make_tbl <- function(data, vars, labels, statistic, continuous_vars) {
  pvals <- calc_manual_pvals(data, "approach", vars, continuous_vars)

  data %>%
    select(approach, all_of(vars)) %>%
    tbl_summary(
      by = approach,
      label = labels,
      statistic = statistic,
      digits = all_continuous() ~ 1,
      missing = "ifany"
    ) %>%
    attach_manual_pvals(pvals)
}

baseline_vars <- c(
  "Age (at time of surgery)", "BMI", "CCI", "ASA (1-5)",
  "HTN status (0=No or 1=Yes)", "DM2 status (0=No or 1=Yes)", "HLD (0=No or 1=Yes)",
  "prior Inguinal Hernia/pelvic surgery (0=No or 1=Yes)",
  "Prior Abdominal Surgery (0=No or 1=Yes)",
  "Pre-op Hgb", "Pre-op PSA", "Pre-op Prostate Volume (g)"
)
baseline_cont <- c(
  "Age (at time of surgery)", "BMI", "CCI",
  "Pre-op Hgb", "Pre-op PSA", "Pre-op Prostate Volume (g)"
)

preop_vars <- c(
  "SHIM Score (pre-op)", "IPSS (pre-op)", "QOL (pre-op)",
  "Pre-Op Biopsy Done (0=No 1=Yes)",
  "Pre-Op Biopsy Result (0=Neg 1=Pos)",
  "Pre-Op Foley Present (0=No 1=Yes)"
)
preop_cont <- c("SHIM Score (pre-op)", "IPSS (pre-op)", "QOL (pre-op)")

intraop_vars <- c(
  "Console Time (minutes)", "Operative Time (minutes)", "EBL (cc)",
  "Conversion (0=No or 1=Yes)",
  "Lymph Node Dissection (0=No or 1=Yes)",
  "Drain placement (0=No or 1=Yes)",
  "pRBCs given (0=No 1=Yes)",
  "delta Hgb"
)
intraop_cont <- c("Console Time (minutes)", "Operative Time (minutes)", "EBL (cc)", "delta Hgb")

histology_vars <- c(
  "Specimen Weight (g)",
  "Specimen weight/pre-op estmated weight",
  "Pathologic Diagnosis (incidental malignancy) 0= benign 1= malignant"
)
histology_cont <- c("Specimen Weight (g)", "Specimen weight/pre-op estmated weight")

postop_care_vars <- c(
  "LOS (0=Same Day 1=Inpatient)",
  "LOS (hours) (look at note times)",
  "Narcotics (PO day 0-1) (0 = no, 1 = yes)",
  "Postop Pain Score (PACU)",
  "Foley Duration (Days post-op)"
)
postop_care_cont <- c("LOS (hours) (look at note times)", "Postop Pain Score (PACU)", "Foley Duration (Days post-op)")

outcome_vars <- c(
  "30 day Complications (0=no 1=Yes)",
  "30-Day Readmission (0=No or 1=Yes)",
  "Post-op PVR",
  "Early Continence at 6 Weeks (0=No or 1=Yes) continent = no pads or 1 protection pad",
  "Continence 3 Months (0=No or 1=Yes)"
)
outcome_cont <- c("Post-op PVR")

baseline_tbl <- make_tbl(
  df,
  vars = baseline_vars,
  labels = baseline_labels,
  statistic = list(
    all_continuous() ~ "{mean} ({sd})",
    `ASA (1-5)` ~ "{n} ({p}%)",
    all_categorical() ~ "{n} ({p}%)"
  ),
  continuous_vars = baseline_cont
)

preop_tbl <- make_tbl(
  df,
  vars = preop_vars,
  labels = preop_labels,
  statistic = list(
    c(`SHIM Score (pre-op)`, `IPSS (pre-op)`, `QOL (pre-op)`) ~ "{median} ({p25}, {p75})",
    all_categorical() ~ "{n} ({p}%)"
  ),
  continuous_vars = preop_cont
)

intraop_tbl <- make_tbl(
  df,
  vars = intraop_vars,
  labels = intraop_labels,
  statistic = list(
    all_continuous() ~ "{mean} ({sd})",
    all_categorical() ~ "{n} ({p}%)"
  ),
  continuous_vars = intraop_cont
)

histology_tbl <- make_tbl(
  df,
  vars = histology_vars,
  labels = histology_labels,
  statistic = list(
    all_continuous() ~ "{mean} ({sd})",
    all_categorical() ~ "{n} ({p}%)"
  ),
  continuous_vars = histology_cont
)

postop_care_tbl <- make_tbl(
  df,
  vars = postop_care_vars,
  labels = postop_care_labels,
  statistic = list(
    `LOS (hours) (look at note times)` ~ "{mean} ({sd})",
    `Postop Pain Score (PACU)` ~ "{mean} ({sd})",
    `Foley Duration (Days post-op)` ~ "{median} ({p25}, {p75})",
    all_categorical() ~ "{n} ({p}%)"
  ),
  continuous_vars = postop_care_cont
)

outcomes_tbl <- make_tbl(
  df,
  vars = outcome_vars,
  labels = outcome_labels,
  statistic = list(
    `Post-op PVR` ~ "{median} ({p25}, {p75})",
    all_categorical() ~ "{n} ({p}%)"
  ),
  continuous_vars = outcome_cont
)

final_tbl <- tbl_stack(
  tbls = list(
    baseline_tbl,
    preop_tbl,
    intraop_tbl,
    histology_tbl,
    postop_care_tbl,
    outcomes_tbl
  ),
  group_header = c(
    "Baseline characteristics",
    "Pre-operative variables",
    "Intraoperative parameters",
    "Histopathology",
    "Postoperative care",
    "Postoperative outcomes"
  )
) %>%
  modify_column_unhide(p.value) %>%
  bold_labels()

final_tbl| Characteristic | Extraperitoneal N = 331 |
Transvesical N = 251 |
P-value |
|---|---|---|---|
| Baseline characteristics | |||
| Age (yr) | 72.4 (6.8) | 71.2 (7.2) | 0.654 |
| BMI (kg/m^2) | 27.6 (5.2) | 26.9 (4.6) | 0.668 |
| Unknown | 2 | 0 | |
| CCI | 0.452 | ||
| 1 | 1 (3.1%) | 2 (8.0%) | |
| 2 | 6 (19%) | 6 (24%) | |
| 3 | 16 (50%) | 12 (48%) | |
| 4 | 9 (28%) | 2 (8.0%) | |
| 5 | 0 (0%) | 2 (8.0%) | |
| 6 | 0 (0%) | 1 (4.0%) | |
| Unknown | 1 | 0 | |
| ASA physical status grading | 0.457 | ||
| 2 | 17 (55%) | 17 (68%) | |
| 3 | 13 (42%) | 8 (32%) | |
| 4 | 1 (3.2%) | 0 (0%) | |
| Unknown | 2 | 0 | |
| History of hypertension | 21 (64%) | 11 (44%) | 0.185 |
| History of type 2 diabetes mellitus | 6 (18%) | 4 (16%) | 1.000 |
| History of hyperlipidemia | 22 (67%) | 13 (52%) | 0.290 |
| History of prior inguinal/pelvic surgery | 5 (15%) | 4 (16%) | 1.000 |
| History of prior abdominal surgery | 16 (48%) | 2 (8.0%) | 0.001 |
| Pre-op Hgb | 13.6 (1.4) | 12.9 (1.5) | 0.097 |
| Unknown | 7 | 0 | |
| Pre-op PSA (ng/mL) | 7.4 (7.9) | 6.5 (5.1) | 1.000 |
| Unknown | 8 | 8 | |
| Prostate volume (ml) | 125.2 (49.4) | 120.3 (37.4) | 0.975 |
| Pre-operative variables | |||
| SHIM | 12.0 (3.0, 16.0) | 15.0 (7.5, 19.5) | 0.384 |
| Unknown | 8 | 9 | |
| IPSS | 20.0 (12.0, 25.0) | 19.0 (15.0, 24.0) | 0.811 |
| Unknown | 4 | 8 | |
| QoL | 0.307 | ||
| 1 | 2 (13%) | 1 (6.3%) | |
| 2 | 1 (6.3%) | 2 (13%) | |
| 3 | 3 (19%) | 4 (25%) | |
| 4 | 2 (13%) | 6 (38%) | |
| 5 | 2 (13%) | 1 (6.3%) | |
| 6 | 6 (38%) | 2 (13%) | |
| Unknown | 17 | 9 | |
| Biopsy done | 6 (18%) | 6 (24%) | 0.745 |
| Malignancy on biopsy | 1.000 | ||
| Negative | 6 (100%) | 6 (86%) | |
| Positive | 0 (0%) | 1 (14%) | |
| Unknown | 27 | 18 | |
| Pre-op foley placed | 13 (39%) | 14 (56%) | 0.289 |
| Intraoperative parameters | |||
| Console time (minutes) | 146.1 (55.2) | 138.1 (51.4) | 0.701 |
| Unknown | 18 | 5 | |
| Operative time (minutes) | 181.2 (57.3) | 190.6 (45.2) | 0.192 |
| Unknown | 14 | 0 | |
| Estimated blood loss (mL) | 0.027 | ||
| 25 | 1 (3.1%) | 0 (0%) | |
| 50 | 10 (31%) | 4 (16%) | |
| 75 | 5 (16%) | 1 (4.0%) | |
| 100 | 9 (28%) | 7 (28%) | |
| 125 | 1 (3.1%) | 2 (8.0%) | |
| 150 | 2 (6.3%) | 7 (28%) | |
| 200 | 1 (3.1%) | 4 (16%) | |
| 300 | 2 (6.3%) | 0 (0%) | |
| 500 | 1 (3.1%) | 0 (0%) | |
| Unknown | 1 | 0 | |
| Conversion to multiport | 0 (0%) | 0 (0%) | 1.000 |
| Lymph node dissection | 0 (0%) | 0 (0%) | 1.000 |
| Drain placement | 1 (3.0%) | 0 (0%) | 1.000 |
| Blood units given | 0 (0%) | 0 (0%) | 1.000 |
| dHgb (%) | -0.8 (0.7) | -0.6 (1.1) | 0.612 |
| Unknown | 14 | 8 | |
| Histopathology | |||
| Specimen weight (g) | 74.7 (40.6) | 64.2 (28.8) | 0.504 |
| Unknown | 2 | 0 | |
| Specimen wt/pre-op estimated wt | 0.6 (0.1) | 0.5 (0.2) | 0.255 |
| Unknown | 2 | 0 | |
| Incidental malignancy finding | 5 (16%) | 3 (12%) | 1.000 |
| Unknown | 1 | 0 | |
| Postoperative care | |||
| Length of stay <24 hours | 0.377 | ||
| Same Day | 11 (55%) | 10 (40%) | |
| Inpatient | 9 (45%) | 15 (60%) | |
| Unknown | 13 | 0 | |
| Average length of stay (hours) | 18.4 (14.3) | 18.4 (9.7) | 0.423 |
| Unknown | 13 | 0 | |
| Narcotics use post-op day 0-1 | 1 (4.0%) | 5 (20%) | 0.189 |
| Unknown | 8 | 0 | |
| Post Op Pain Score | 0.009 | ||
| 0 | 1 (6.3%) | 8 (35%) | |
| 1 | 2 (13%) | 2 (8.7%) | |
| 2 | 1 (6.3%) | 2 (8.7%) | |
| 3 | 0 (0%) | 2 (8.7%) | |
| 4 | 3 (19%) | 2 (8.7%) | |
| 5 | 1 (6.3%) | 5 (22%) | |
| 6 | 1 (6.3%) | 1 (4.3%) | |
| 7 | 2 (13%) | 0 (0%) | |
| 8 | 5 (31%) | 1 (4.3%) | |
| Unknown | 17 | 2 | |
| Foley catheter duration (days) | 9.0 (6.0, 10.0) | 7.0 (6.0, 9.0) | 0.204 |
| Unknown | 7 | 2 | |
| Postoperative outcomes | |||
| 30 day postoperative complications (Clavien >=2 only) | 4 (15%) | 4 (17%) | 1.000 |
| Unknown | 6 | 2 | |
| 30 day readmission | 1 (4.0%) | 1 (4.2%) | 1.000 |
| Unknown | 8 | 1 | |
| Post-op PVR | 9.0 (0.0, 19.0) | 5.0 (0.0, 18.0) | 0.846 |
| Unknown | 6 | 18 | |
| Early Continence at 4 weeks | 27 (90%) | 21 (95%) | 0.629 |
| Unknown | 3 | 3 | |
| Continence at 3 months | 20 (100%) | 22 (100%) | 1.000 |
| Unknown | 13 | 3 | |
| 1 Mean (SD); n (%) | |||
1.6 Breaking Down the Code
This script:
1. Reads the data from Excel
2. Recodes raw
0/1 variables into readable categories
3. Groups variables into
clinical sections
4. Builds summary statistics for each section
5. Computes p-values comparing the two surgical approaches
6.
Combines everything into one polished table
1.6.2 Create Label Lists
baseline_labels
preop_labels
intraop_labels
histology_labels
postop_care_labels
outcome_labels
1.6.4 Compute p-value safely
This is the section that was the most challenging.
1.6.4.1 Wilcox for continuous variable
1.6.5 Build a p-value table for many variables
1.6.7 Create a reusable table-making function
1.6.8 Define which variables belong in each section
1.6.10 Stack all sections into one final table
1.7 Table with Statistics Info
I wanted an indication of which statistic test was used for each comparison.
df <- read_excel("MASTER EP vs TV simples - deidentified.xlsx", sheet = "Sheet1") %>%
  mutate(
    approach = factor(
      `Surgical Approach (1=EP or 2=TV)`,
      levels = c(1, 2),
      labels = c("Extraperitoneal", "Transvesical")
    ),

    `HTN status (0=No or 1=Yes)` = factor(`HTN status (0=No or 1=Yes)`, levels = c(0, 1), labels = c("No", "Yes")),
    `DM2 status (0=No or 1=Yes)` = factor(`DM2 status (0=No or 1=Yes)`, levels = c(0, 1), labels = c("No", "Yes")),
    `HLD (0=No or 1=Yes)` = factor(`HLD (0=No or 1=Yes)`, levels = c(0, 1), labels = c("No", "Yes")),
    `prior Inguinal Hernia/pelvic surgery (0=No or 1=Yes)` = factor(`prior Inguinal Hernia/pelvic surgery (0=No or 1=Yes)`, levels = c(0, 1), labels = c("No", "Yes")),
    `Prior Abdominal Surgery (0=No or 1=Yes)` = factor(`Prior Abdominal Surgery (0=No or 1=Yes)`, levels = c(0, 1), labels = c("No", "Yes")),

    `Pre-Op Biopsy Done (0=No 1=Yes)` = factor(`Pre-Op Biopsy Done (0=No 1=Yes)`, levels = c(0, 1), labels = c("No", "Yes")),
    `Pre-Op Biopsy Result (0=Neg 1=Pos)` = factor(`Pre-Op Biopsy Result (0=Neg 1=Pos)`, levels = c(0, 1), labels = c("Negative", "Positive")),
    `Pre-Op Foley Present (0=No 1=Yes)` = factor(`Pre-Op Foley Present (0=No 1=Yes)`, levels = c(0, 1), labels = c("No", "Yes")),

    `Lymph Node Dissection (0=No or 1=Yes)` = factor(`Lymph Node Dissection (0=No or 1=Yes)`, levels = c(0, 1), labels = c("No", "Yes")),
    `Conversion (0=No or 1=Yes)` = factor(`Conversion (0=No or 1=Yes)`, levels = c(0, 1), labels = c("No", "Yes")),
    `Drain placement (0=No or 1=Yes)` = factor(`Drain placement (0=No or 1=Yes)`, levels = c(0, 1), labels = c("No", "Yes")),
    `pRBCs given (0=No 1=Yes)` = factor(`pRBCs given (0=No 1=Yes)`, levels = c(0, 1), labels = c("No", "Yes")),

    `LOS (0=Same Day 1=Inpatient)` = factor(`LOS (0=Same Day 1=Inpatient)`, levels = c(0, 1), labels = c("Same Day", "Inpatient")),
    `Narcotics (PO day 0-1) (0 = no, 1 = yes)` = factor(`Narcotics (PO day 0-1) (0 = no, 1 = yes)`, levels = c(0, 1), labels = c("No", "Yes")),
    `30-Day Readmission (0=No or 1=Yes)` = factor(`30-Day Readmission (0=No or 1=Yes)`, levels = c(0, 1), labels = c("No", "Yes")),
    `Early Continence at 6 Weeks (0=No or 1=Yes) continent = no pads or 1 protection pad` =
      factor(`Early Continence at 6 Weeks (0=No or 1=Yes) continent = no pads or 1 protection pad`,
             levels = c(0, 1), labels = c("No", "Yes")),
    `Continence 3 Months (0=No or 1=Yes)` = factor(`Continence 3 Months (0=No or 1=Yes)`, levels = c(0, 1), labels = c("No", "Yes")),
    `30 day Complications (0=no 1=Yes)` = factor(`30 day Complications (0=no 1=Yes)`, levels = c(0, 1), labels = c("No", "Yes")),

    `ASA (1-5)` = factor(`ASA (1-5)`)
  )

baseline_labels <- list(
  `Age (at time of surgery)` ~ "Age (yr)",
  BMI ~ "BMI (kg/m^2)",
  CCI ~ "CCI",
  `ASA (1-5)` ~ "ASA physical status grading",
  `HTN status (0=No or 1=Yes)` ~ "History of hypertension",
  `DM2 status (0=No or 1=Yes)` ~ "History of type 2 diabetes mellitus",
  `HLD (0=No or 1=Yes)` ~ "History of hyperlipidemia",
  `prior Inguinal Hernia/pelvic surgery (0=No or 1=Yes)` ~ "History of prior inguinal/pelvic surgery",
  `Prior Abdominal Surgery (0=No or 1=Yes)` ~ "History of prior abdominal surgery",
  `Pre-op Hgb` ~ "Pre-op Hgb",
  `Pre-op PSA` ~ "Pre-op PSA (ng/mL)",
  `Pre-op Prostate Volume (g)` ~ "Prostate volume (ml)"
)

preop_labels <- list(
  `SHIM Score (pre-op)` ~ "SHIM",
  `IPSS (pre-op)` ~ "IPSS",
  `QOL (pre-op)` ~ "QoL",
  `Pre-Op Biopsy Done (0=No 1=Yes)` ~ "Biopsy done",
  `Pre-Op Biopsy Result (0=Neg 1=Pos)` ~ "Malignancy on biopsy",
  `Pre-Op Foley Present (0=No 1=Yes)` ~ "Pre-op foley placed"
)

intraop_labels <- list(
  `Console Time (minutes)` ~ "Console time (minutes)",
  `Operative Time (minutes)` ~ "Operative time (minutes)",
  `EBL (cc)` ~ "Estimated blood loss (mL)",
  `Conversion (0=No or 1=Yes)` ~ "Conversion to multiport",
  `Lymph Node Dissection (0=No or 1=Yes)` ~ "Lymph node dissection",
  `Drain placement (0=No or 1=Yes)` ~ "Drain placement",
  `pRBCs given (0=No 1=Yes)` ~ "Blood units given",
  `delta Hgb` ~ "dHgb (%)"
)

histology_labels <- list(
  `Specimen Weight (g)` ~ "Specimen weight (g)",
  `Specimen weight/pre-op estmated weight` ~ "Specimen wt/pre-op estimated wt",
  `Pathologic Diagnosis (incidental malignancy) 0= benign 1= malignant` ~ "Incidental malignancy finding"
)

postop_care_labels <- list(
  `LOS (0=Same Day 1=Inpatient)` ~ "Length of stay <24 hours",
  `LOS (hours) (look at note times)` ~ "Average length of stay (hours)",
  `Narcotics (PO day 0-1) (0 = no, 1 = yes)` ~ "Narcotics use post-op day 0-1",
  `Postop Pain Score (PACU)` ~ "Post Op Pain Score",
  `Foley Duration (Days post-op)` ~ "Foley catheter duration (days)"
)

outcome_labels <- list(
  `30 day Complications (0=no 1=Yes)` ~ "30 day postoperative complications (Clavien >=2 only)",
  `30-Day Readmission (0=No or 1=Yes)` ~ "30 day readmission",
  `Post-op PVR` ~ "Post-op PVR",
  `Early Continence at 6 Weeks (0=No or 1=Yes) continent = no pads or 1 protection pad` ~ "Early Continence at 4 weeks",
  `Continence 3 Months (0=No or 1=Yes)` ~ "Continence at 3 months"
)

format_p <- function(x) {
  dplyr::case_when(
    is.na(x) ~ NA_character_,
    x < 0.001 ~ "<0.001",
    TRUE ~ formatC(x, format = "f", digits = 3)
  )
}

safe_test <- function(data, group_var, var, continuous = FALSE) {
  x <- data[[var]]
  g <- data[[group_var]]
  keep <- complete.cases(x, g)
  x <- x[keep]
  g <- g[keep]

  if (length(unique(g)) < 2) {
    return(list(p = NA_real_, test = NA_character_))
  }

  tryCatch({
    if (continuous) {
      p <- wilcox.test(x ~ g)$p.value
      list(p = p, test = "Wilcoxon rank-sum")
    } else {
      tab <- table(x, g)
      if (any(dim(tab) < 2)) {
        return(list(p = NA_real_, test = NA_character_))
      }
      if (all(dim(tab) == c(2, 2))) {
        p <- fisher.test(tab)$p.value
        list(p = p, test = "Fisher's exact")
      } else {
        p <- suppressWarnings(chisq.test(tab, correct = FALSE)$p.value)
        list(p = p, test = "Chi-square")
      }
    }
  }, error = function(e) {
    list(p = NA_real_, test = NA_character_)
  })
}

calc_manual_stats <- function(data, group_var, vars, continuous_vars) {
  map_dfr(vars, function(v) {
    res <- safe_test(data, group_var, v, continuous = v %in% continuous_vars)
    tibble(
      variable = v,
      manual_p = res$p,
      manual_test = res$test
    )
  })
}

attach_manual_stats <- function(tbl, stats) {
  tbl %>%
    modify_table_body(
      ~ .x %>%
        left_join(stats, by = "variable") %>%
        mutate(
          p.value = if_else(row_type == "label", format_p(manual_p), NA_character_),
          stat_test = if_else(row_type == "label", manual_test, NA_character_)
        ) %>%
        select(-manual_p, -manual_test)
    ) %>%
    modify_header(
      p.value ~ "**P-value**",
      stat_test ~ "**Test used**"
    ) %>%
    modify_column_unhide(c(p.value, stat_test))
}

make_tbl <- function(data, vars, labels, statistic, continuous_vars) {
  stats <- calc_manual_stats(data, "approach", vars, continuous_vars)

  data %>%
    select(approach, all_of(vars)) %>%
    tbl_summary(
      by = approach,
      label = labels,
      statistic = statistic,
      digits = all_continuous() ~ 1,
      missing = "ifany"
    ) %>%
    attach_manual_stats(stats)
}

baseline_vars <- c(
  "Age (at time of surgery)", "BMI", "CCI", "ASA (1-5)",
  "HTN status (0=No or 1=Yes)", "DM2 status (0=No or 1=Yes)", "HLD (0=No or 1=Yes)",
  "prior Inguinal Hernia/pelvic surgery (0=No or 1=Yes)",
  "Prior Abdominal Surgery (0=No or 1=Yes)",
  "Pre-op Hgb", "Pre-op PSA", "Pre-op Prostate Volume (g)"
)
baseline_cont <- c(
  "Age (at time of surgery)", "BMI", "CCI",
  "Pre-op Hgb", "Pre-op PSA", "Pre-op Prostate Volume (g)"
)

preop_vars <- c(
  "SHIM Score (pre-op)", "IPSS (pre-op)", "QOL (pre-op)",
  "Pre-Op Biopsy Done (0=No 1=Yes)",
  "Pre-Op Biopsy Result (0=Neg 1=Pos)",
  "Pre-Op Foley Present (0=No 1=Yes)"
)
preop_cont <- c("SHIM Score (pre-op)", "IPSS (pre-op)", "QOL (pre-op)")

intraop_vars <- c(
  "Console Time (minutes)", "Operative Time (minutes)", "EBL (cc)",
  "Conversion (0=No or 1=Yes)",
  "Lymph Node Dissection (0=No or 1=Yes)",
  "Drain placement (0=No or 1=Yes)",
  "pRBCs given (0=No 1=Yes)",
  "delta Hgb"
)
intraop_cont <- c("Console Time (minutes)", "Operative Time (minutes)", "EBL (cc)", "delta Hgb")

histology_vars <- c(
  "Specimen Weight (g)",
  "Specimen weight/pre-op estmated weight",
  "Pathologic Diagnosis (incidental malignancy) 0= benign 1= malignant"
)
histology_cont <- c("Specimen Weight (g)", "Specimen weight/pre-op estmated weight")

postop_care_vars <- c(
  "LOS (0=Same Day 1=Inpatient)",
  "LOS (hours) (look at note times)",
  "Narcotics (PO day 0-1) (0 = no, 1 = yes)",
  "Postop Pain Score (PACU)",
  "Foley Duration (Days post-op)"
)
postop_care_cont <- c("LOS (hours) (look at note times)", "Postop Pain Score (PACU)", "Foley Duration (Days post-op)")

outcome_vars <- c(
  "30 day Complications (0=no 1=Yes)",
  "30-Day Readmission (0=No or 1=Yes)",
  "Post-op PVR",
  "Early Continence at 6 Weeks (0=No or 1=Yes) continent = no pads or 1 protection pad",
  "Continence 3 Months (0=No or 1=Yes)"
)
outcome_cont <- c("Post-op PVR")

baseline_tbl <- make_tbl(
  df,
  vars = baseline_vars,
  labels = baseline_labels,
  statistic = list(
    all_continuous() ~ "{mean} ({sd})",
    `ASA (1-5)` ~ "{n} ({p}%)",
    all_categorical() ~ "{n} ({p}%)"
  ),
  continuous_vars = baseline_cont
)

preop_tbl <- make_tbl(
  df,
  vars = preop_vars,
  labels = preop_labels,
  statistic = list(
    c(`SHIM Score (pre-op)`, `IPSS (pre-op)`, `QOL (pre-op)`) ~ "{median} ({p25}, {p75})",
    all_categorical() ~ "{n} ({p}%)"
  ),
  continuous_vars = preop_cont
)

intraop_tbl <- make_tbl(
  df,
  vars = intraop_vars,
  labels = intraop_labels,
  statistic = list(
    all_continuous() ~ "{mean} ({sd})",
    all_categorical() ~ "{n} ({p}%)"
  ),
  continuous_vars = intraop_cont
)

histology_tbl <- make_tbl(
  df,
  vars = histology_vars,
  labels = histology_labels,
  statistic = list(
    all_continuous() ~ "{mean} ({sd})",
    all_categorical() ~ "{n} ({p}%)"
  ),
  continuous_vars = histology_cont
)

postop_care_tbl <- make_tbl(
  df,
  vars = postop_care_vars,
  labels = postop_care_labels,
  statistic = list(
    `LOS (hours) (look at note times)` ~ "{mean} ({sd})",
    `Postop Pain Score (PACU)` ~ "{mean} ({sd})",
    `Foley Duration (Days post-op)` ~ "{median} ({p25}, {p75})",
    all_categorical() ~ "{n} ({p}%)"
  ),
  continuous_vars = postop_care_cont
)

outcomes_tbl <- make_tbl(
  df,
  vars = outcome_vars,
  labels = outcome_labels,
  statistic = list(
    `Post-op PVR` ~ "{median} ({p25}, {p75})",
    all_categorical() ~ "{n} ({p}%)"
  ),
  continuous_vars = outcome_cont
)

final_tbl_2 <- tbl_stack(
  tbls = list(
    baseline_tbl,
    preop_tbl,
    intraop_tbl,
    histology_tbl,
    postop_care_tbl,
    outcomes_tbl
  ),
  group_header = c(
    "Baseline characteristics",
    "Pre-operative variables",
    "Intraoperative parameters",
    "Histopathology",
    "Postoperative care",
    "Postoperative outcomes"
  )
) %>%
  modify_column_unhide(c(p.value, stat_test)) %>%
  bold_labels()

final_tbl_2| Characteristic | Extraperitoneal N = 331 |
Transvesical N = 251 |
P-value | Test used |
|---|---|---|---|---|
| Baseline characteristics | ||||
| Age (yr) | 72.4 (6.8) | 71.2 (7.2) | 0.654 | Wilcoxon rank-sum |
| BMI (kg/m^2) | 27.6 (5.2) | 26.9 (4.6) | 0.668 | Wilcoxon rank-sum |
| Unknown | 2 | 0 | ||
| CCI | 0.452 | Wilcoxon rank-sum | ||
| 1 | 1 (3.1%) | 2 (8.0%) | ||
| 2 | 6 (19%) | 6 (24%) | ||
| 3 | 16 (50%) | 12 (48%) | ||
| 4 | 9 (28%) | 2 (8.0%) | ||
| 5 | 0 (0%) | 2 (8.0%) | ||
| 6 | 0 (0%) | 1 (4.0%) | ||
| Unknown | 1 | 0 | ||
| ASA physical status grading | 0.457 | Chi-square | ||
| 2 | 17 (55%) | 17 (68%) | ||
| 3 | 13 (42%) | 8 (32%) | ||
| 4 | 1 (3.2%) | 0 (0%) | ||
| Unknown | 2 | 0 | ||
| History of hypertension | 21 (64%) | 11 (44%) | 0.185 | Fisher's exact |
| History of type 2 diabetes mellitus | 6 (18%) | 4 (16%) | 1.000 | Fisher's exact |
| History of hyperlipidemia | 22 (67%) | 13 (52%) | 0.290 | Fisher's exact |
| History of prior inguinal/pelvic surgery | 5 (15%) | 4 (16%) | 1.000 | Fisher's exact |
| History of prior abdominal surgery | 16 (48%) | 2 (8.0%) | 0.001 | Fisher's exact |
| Pre-op Hgb | 13.6 (1.4) | 12.9 (1.5) | 0.097 | Wilcoxon rank-sum |
| Unknown | 7 | 0 | ||
| Pre-op PSA (ng/mL) | 7.4 (7.9) | 6.5 (5.1) | 1.000 | Wilcoxon rank-sum |
| Unknown | 8 | 8 | ||
| Prostate volume (ml) | 125.2 (49.4) | 120.3 (37.4) | 0.975 | Wilcoxon rank-sum |
| Pre-operative variables | ||||
| SHIM | 12.0 (3.0, 16.0) | 15.0 (7.5, 19.5) | 0.384 | Wilcoxon rank-sum |
| Unknown | 8 | 9 | ||
| IPSS | 20.0 (12.0, 25.0) | 19.0 (15.0, 24.0) | 0.811 | Wilcoxon rank-sum |
| Unknown | 4 | 8 | ||
| QoL | 0.307 | Wilcoxon rank-sum | ||
| 1 | 2 (13%) | 1 (6.3%) | ||
| 2 | 1 (6.3%) | 2 (13%) | ||
| 3 | 3 (19%) | 4 (25%) | ||
| 4 | 2 (13%) | 6 (38%) | ||
| 5 | 2 (13%) | 1 (6.3%) | ||
| 6 | 6 (38%) | 2 (13%) | ||
| Unknown | 17 | 9 | ||
| Biopsy done | 6 (18%) | 6 (24%) | 0.745 | Fisher's exact |
| Malignancy on biopsy | 1.000 | Fisher's exact | ||
| Negative | 6 (100%) | 6 (86%) | ||
| Positive | 0 (0%) | 1 (14%) | ||
| Unknown | 27 | 18 | ||
| Pre-op foley placed | 13 (39%) | 14 (56%) | 0.289 | Fisher's exact |
| Intraoperative parameters | ||||
| Console time (minutes) | 146.1 (55.2) | 138.1 (51.4) | 0.701 | Wilcoxon rank-sum |
| Unknown | 18 | 5 | ||
| Operative time (minutes) | 181.2 (57.3) | 190.6 (45.2) | 0.192 | Wilcoxon rank-sum |
| Unknown | 14 | 0 | ||
| Estimated blood loss (mL) | 0.027 | Wilcoxon rank-sum | ||
| 25 | 1 (3.1%) | 0 (0%) | ||
| 50 | 10 (31%) | 4 (16%) | ||
| 75 | 5 (16%) | 1 (4.0%) | ||
| 100 | 9 (28%) | 7 (28%) | ||
| 125 | 1 (3.1%) | 2 (8.0%) | ||
| 150 | 2 (6.3%) | 7 (28%) | ||
| 200 | 1 (3.1%) | 4 (16%) | ||
| 300 | 2 (6.3%) | 0 (0%) | ||
| 500 | 1 (3.1%) | 0 (0%) | ||
| Unknown | 1 | 0 | ||
| Conversion to multiport | 0 (0%) | 0 (0%) | 1.000 | Fisher's exact |
| Lymph node dissection | 0 (0%) | 0 (0%) | 1.000 | Fisher's exact |
| Drain placement | 1 (3.0%) | 0 (0%) | 1.000 | Fisher's exact |
| Blood units given | 0 (0%) | 0 (0%) | 1.000 | Fisher's exact |
| dHgb (%) | -0.8 (0.7) | -0.6 (1.1) | 0.612 | Wilcoxon rank-sum |
| Unknown | 14 | 8 | ||
| Histopathology | ||||
| Specimen weight (g) | 74.7 (40.6) | 64.2 (28.8) | 0.504 | Wilcoxon rank-sum |
| Unknown | 2 | 0 | ||
| Specimen wt/pre-op estimated wt | 0.6 (0.1) | 0.5 (0.2) | 0.255 | Wilcoxon rank-sum |
| Unknown | 2 | 0 | ||
| Incidental malignancy finding | 5 (16%) | 3 (12%) | 1.000 | Fisher's exact |
| Unknown | 1 | 0 | ||
| Postoperative care | ||||
| Length of stay <24 hours | 0.377 | Fisher's exact | ||
| Same Day | 11 (55%) | 10 (40%) | ||
| Inpatient | 9 (45%) | 15 (60%) | ||
| Unknown | 13 | 0 | ||
| Average length of stay (hours) | 18.4 (14.3) | 18.4 (9.7) | 0.423 | Wilcoxon rank-sum |
| Unknown | 13 | 0 | ||
| Narcotics use post-op day 0-1 | 1 (4.0%) | 5 (20%) | 0.189 | Fisher's exact |
| Unknown | 8 | 0 | ||
| Post Op Pain Score | 0.009 | Wilcoxon rank-sum | ||
| 0 | 1 (6.3%) | 8 (35%) | ||
| 1 | 2 (13%) | 2 (8.7%) | ||
| 2 | 1 (6.3%) | 2 (8.7%) | ||
| 3 | 0 (0%) | 2 (8.7%) | ||
| 4 | 3 (19%) | 2 (8.7%) | ||
| 5 | 1 (6.3%) | 5 (22%) | ||
| 6 | 1 (6.3%) | 1 (4.3%) | ||
| 7 | 2 (13%) | 0 (0%) | ||
| 8 | 5 (31%) | 1 (4.3%) | ||
| Unknown | 17 | 2 | ||
| Foley catheter duration (days) | 9.0 (6.0, 10.0) | 7.0 (6.0, 9.0) | 0.204 | Wilcoxon rank-sum |
| Unknown | 7 | 2 | ||
| Postoperative outcomes | ||||
| 30 day postoperative complications (Clavien >=2 only) | 4 (15%) | 4 (17%) | 1.000 | Fisher's exact |
| Unknown | 6 | 2 | ||
| 30 day readmission | 1 (4.0%) | 1 (4.2%) | 1.000 | Fisher's exact |
| Unknown | 8 | 1 | ||
| Post-op PVR | 9.0 (0.0, 19.0) | 5.0 (0.0, 18.0) | 0.846 | Wilcoxon rank-sum |
| Unknown | 6 | 18 | ||
| Early Continence at 4 weeks | 27 (90%) | 21 (95%) | 0.629 | Fisher's exact |
| Unknown | 3 | 3 | ||
| Continence at 3 months | 20 (100%) | 22 (100%) | 1.000 | Fisher's exact |
| Unknown | 13 | 3 | ||
| 1 Mean (SD); n (%) | ||||
1.8 Improving Aesthetics of Table
final_tbl %>%
  as_gt() %>%
  gt::tab_style(
    style = list(
      gt::cell_text(weight = "bold"),
      gt::cell_borders(
        sides = c("top", "bottom"),
        color = "black",
        weight = gt::px(2)
      )
    ),
    locations = gt::cells_row_groups()
  ) %>%
  gt::tab_options(
    row_group.as_column = FALSE
)| Characteristic | Extraperitoneal N = 331 |
Transvesical N = 251 |
P-value |
|---|---|---|---|
| Baseline characteristics | |||
| Age (yr) | 72.4 (6.8) | 71.2 (7.2) | 0.654 |
| BMI (kg/m^2) | 27.6 (5.2) | 26.9 (4.6) | 0.668 |
| Unknown | 2 | 0 | |
| CCI | 0.452 | ||
| 1 | 1 (3.1%) | 2 (8.0%) | |
| 2 | 6 (19%) | 6 (24%) | |
| 3 | 16 (50%) | 12 (48%) | |
| 4 | 9 (28%) | 2 (8.0%) | |
| 5 | 0 (0%) | 2 (8.0%) | |
| 6 | 0 (0%) | 1 (4.0%) | |
| Unknown | 1 | 0 | |
| ASA physical status grading | 0.457 | ||
| 2 | 17 (55%) | 17 (68%) | |
| 3 | 13 (42%) | 8 (32%) | |
| 4 | 1 (3.2%) | 0 (0%) | |
| Unknown | 2 | 0 | |
| History of hypertension | 21 (64%) | 11 (44%) | 0.185 |
| History of type 2 diabetes mellitus | 6 (18%) | 4 (16%) | 1.000 |
| History of hyperlipidemia | 22 (67%) | 13 (52%) | 0.290 |
| History of prior inguinal/pelvic surgery | 5 (15%) | 4 (16%) | 1.000 |
| History of prior abdominal surgery | 16 (48%) | 2 (8.0%) | 0.001 |
| Pre-op Hgb | 13.6 (1.4) | 12.9 (1.5) | 0.097 |
| Unknown | 7 | 0 | |
| Pre-op PSA (ng/mL) | 7.4 (7.9) | 6.5 (5.1) | 1.000 |
| Unknown | 8 | 8 | |
| Prostate volume (ml) | 125.2 (49.4) | 120.3 (37.4) | 0.975 |
| Pre-operative variables | |||
| SHIM | 12.0 (3.0, 16.0) | 15.0 (7.5, 19.5) | 0.384 |
| Unknown | 8 | 9 | |
| IPSS | 20.0 (12.0, 25.0) | 19.0 (15.0, 24.0) | 0.811 |
| Unknown | 4 | 8 | |
| QoL | 0.307 | ||
| 1 | 2 (13%) | 1 (6.3%) | |
| 2 | 1 (6.3%) | 2 (13%) | |
| 3 | 3 (19%) | 4 (25%) | |
| 4 | 2 (13%) | 6 (38%) | |
| 5 | 2 (13%) | 1 (6.3%) | |
| 6 | 6 (38%) | 2 (13%) | |
| Unknown | 17 | 9 | |
| Biopsy done | 6 (18%) | 6 (24%) | 0.745 |
| Malignancy on biopsy | 1.000 | ||
| Negative | 6 (100%) | 6 (86%) | |
| Positive | 0 (0%) | 1 (14%) | |
| Unknown | 27 | 18 | |
| Pre-op foley placed | 13 (39%) | 14 (56%) | 0.289 |
| Intraoperative parameters | |||
| Console time (minutes) | 146.1 (55.2) | 138.1 (51.4) | 0.701 |
| Unknown | 18 | 5 | |
| Operative time (minutes) | 181.2 (57.3) | 190.6 (45.2) | 0.192 |
| Unknown | 14 | 0 | |
| Estimated blood loss (mL) | 0.027 | ||
| 25 | 1 (3.1%) | 0 (0%) | |
| 50 | 10 (31%) | 4 (16%) | |
| 75 | 5 (16%) | 1 (4.0%) | |
| 100 | 9 (28%) | 7 (28%) | |
| 125 | 1 (3.1%) | 2 (8.0%) | |
| 150 | 2 (6.3%) | 7 (28%) | |
| 200 | 1 (3.1%) | 4 (16%) | |
| 300 | 2 (6.3%) | 0 (0%) | |
| 500 | 1 (3.1%) | 0 (0%) | |
| Unknown | 1 | 0 | |
| Conversion to multiport | 0 (0%) | 0 (0%) | 1.000 |
| Lymph node dissection | 0 (0%) | 0 (0%) | 1.000 |
| Drain placement | 1 (3.0%) | 0 (0%) | 1.000 |
| Blood units given | 0 (0%) | 0 (0%) | 1.000 |
| dHgb (%) | -0.8 (0.7) | -0.6 (1.1) | 0.612 |
| Unknown | 14 | 8 | |
| Histopathology | |||
| Specimen weight (g) | 74.7 (40.6) | 64.2 (28.8) | 0.504 |
| Unknown | 2 | 0 | |
| Specimen wt/pre-op estimated wt | 0.6 (0.1) | 0.5 (0.2) | 0.255 |
| Unknown | 2 | 0 | |
| Incidental malignancy finding | 5 (16%) | 3 (12%) | 1.000 |
| Unknown | 1 | 0 | |
| Postoperative care | |||
| Length of stay <24 hours | 0.377 | ||
| Same Day | 11 (55%) | 10 (40%) | |
| Inpatient | 9 (45%) | 15 (60%) | |
| Unknown | 13 | 0 | |
| Average length of stay (hours) | 18.4 (14.3) | 18.4 (9.7) | 0.423 |
| Unknown | 13 | 0 | |
| Narcotics use post-op day 0-1 | 1 (4.0%) | 5 (20%) | 0.189 |
| Unknown | 8 | 0 | |
| Post Op Pain Score | 0.009 | ||
| 0 | 1 (6.3%) | 8 (35%) | |
| 1 | 2 (13%) | 2 (8.7%) | |
| 2 | 1 (6.3%) | 2 (8.7%) | |
| 3 | 0 (0%) | 2 (8.7%) | |
| 4 | 3 (19%) | 2 (8.7%) | |
| 5 | 1 (6.3%) | 5 (22%) | |
| 6 | 1 (6.3%) | 1 (4.3%) | |
| 7 | 2 (13%) | 0 (0%) | |
| 8 | 5 (31%) | 1 (4.3%) | |
| Unknown | 17 | 2 | |
| Foley catheter duration (days) | 9.0 (6.0, 10.0) | 7.0 (6.0, 9.0) | 0.204 |
| Unknown | 7 | 2 | |
| Postoperative outcomes | |||
| 30 day postoperative complications (Clavien >=2 only) | 4 (15%) | 4 (17%) | 1.000 |
| Unknown | 6 | 2 | |
| 30 day readmission | 1 (4.0%) | 1 (4.2%) | 1.000 |
| Unknown | 8 | 1 | |
| Post-op PVR | 9.0 (0.0, 19.0) | 5.0 (0.0, 18.0) | 0.846 |
| Unknown | 6 | 18 | |
| Early Continence at 4 weeks | 27 (90%) | 21 (95%) | 0.629 |
| Unknown | 3 | 3 | |
| Continence at 3 months | 20 (100%) | 22 (100%) | 1.000 |
| Unknown | 13 | 3 | |
| 1 Mean (SD); n (%) | |||
1.9 Revise the Table Your Way
- Make the categories with significant differences red?
- Bold significant P values?
- Fix the kg/m^2 to actually be superscript in table?
2 Session Info
## [1] "2026-04-25 21:49:49 PDT"## R version 4.5.1 (2025-06-13 ucrt)
## Platform: x86_64-w64-mingw32/x64
## Running under: Windows 11 x64 (build 26200)
##
## Matrix products: default
## LAPACK version 3.12.1
##
## locale:
## [1] LC_COLLATE=English_United States.utf8
## [2] LC_CTYPE=English_United States.utf8
## [3] LC_MONETARY=English_United States.utf8
## [4] LC_NUMERIC=C
## [5] LC_TIME=English_United States.utf8
##
## time zone: America/Los_Angeles
## tzcode source: internal
##
## attached base packages:
## [1] stats graphics grDevices utils datasets methods base
##
## other attached packages:
## [1] ggplot2_4.0.1 gt_1.1.0 gtsummary_2.5.0 tibble_3.3.0
## [5] purrr_1.1.0 dplyr_1.1.4 readxl_1.4.5
##
## loaded via a namespace (and not attached):
## [1] gtable_0.3.6 jsonlite_2.0.0 compiler_4.5.1 tidyselect_1.2.1
## [5] xml2_1.4.0 dichromat_2.0-0.1 tidyr_1.3.1 jquerylib_0.1.4
## [9] scales_1.4.0 yaml_2.3.10 fastmap_1.2.0 R6_2.6.1
## [13] commonmark_2.0.0 cards_0.7.1 labeling_0.4.3 generics_0.1.4
## [17] knitr_1.50 RColorBrewer_1.1-3 bslib_0.9.0 pillar_1.11.0
## [21] rlang_1.1.6 cachem_1.1.0 litedown_0.7 xfun_0.53
## [25] S7_0.2.0 fs_1.6.6 sass_0.4.10 cli_3.6.5
## [29] withr_3.0.2 magrittr_2.0.3 digest_0.6.37 grid_4.5.1
## [33] rstudioapi_0.17.1 markdown_2.0 lifecycle_1.0.5 vctrs_0.6.5
## [37] evaluate_1.0.5 glue_1.8.0 farver_2.1.2 cellranger_1.1.0
## [41] rmarkdown_2.29 tools_4.5.1 pkgconfig_2.0.3 htmltools_0.5.8.1